
Having worked in the support team for a Network Services Provider, it’s fairly common to see customer tickets come in complaining about packet loss or latency through/to our network. Many of these are the result of them running an MTR test to their IP and not fully understanding the results, and with a little education on how to correctly interpret an MTR report they are a little happier and generally more satisfied with the service.
More recently, however, I’ve noticed more and more people giving incorrect advice on the internet via some social communities which perpetuates the problem. There is already a wealth of knowledge on the internet about how to interpret things like ping results or MTR reports, but I’m going to present this anyway as another reference.
This post however deals with the basics of how the internet fits together from a networking standpoint, and we’ll look at some well known things, and some lesser known things.
There is an old term that just about everyone has heard: The Internet is a Series of Tubes. It’s not far from the truth, really, they’re just tubes of copper and fiber which carry electrons and light which through the magic of physics and the progression of technology have allowed us to transmit hundreds, thousands, millions of 0s and 1s across great distances in fractions of a second and send each other cat pictures and rock climbing videos.
Take the following as an example. The two squares represent two ends of a connection, say your computer and my web server. In between and all around are any number of routers at your house, your ISP, their uplinks, peers, and providers, and in turn the uplinks, peers, and providers of my server’s host, their routers, and finally the server itself:
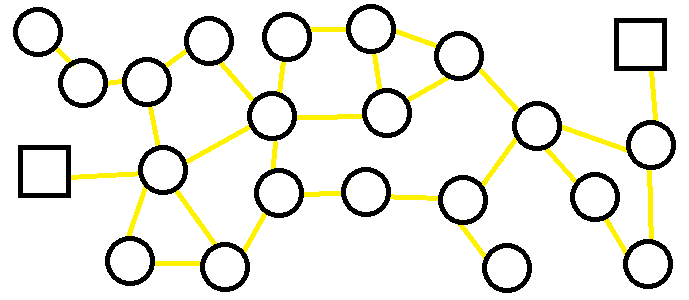
The yellow lines represent links between the different routers, and I haven’t included their potential links outside the image to other providers. This, essentially, is what the internet looks like. Via protocols like BGP, each router is aware of what traffic it is responsible for routing (e.g. my router may be announcing 198.51.100.0/24 to the internet, through BGP my providers will also let the rest of the internet know that in order for traffic to reach 198.51.100.48 they well need to come to my router) and they also keep track of what their neighbors are announcing. This allows the internet to be fluid and dynamic in terms of IP addresses moving around between providers and so on.
So let’s say you wanted to reach my server, as you did when you opened this web page. The simplest example is the one we gravitate to: it simply uses the shortest possible path:
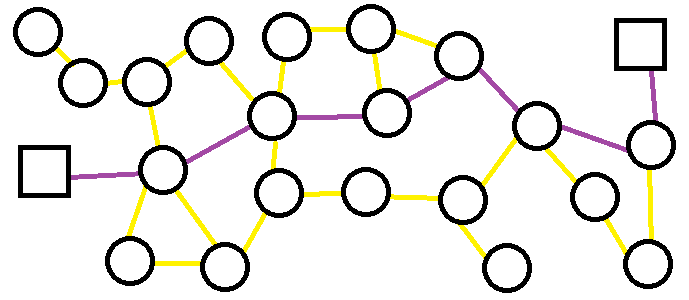
The purple line represents the common “hops” between devices, and in this case the traffic passes through 6 routers on it’s way from your computer to my server, and then the same 6 hops when my server sends back the page data. In the “old days” of the internet, this was actually a pretty accurate representation of traffic flow, as there were (compared to today’s internet) only a handful of providers and only a couple of links when it came to crossing large distances, such as Washington DC to Los Angeles.
Today there are significantly more providers, and millions of links between various parts of the world. Each provider has peering agreements with each other that determine things like how much traffic can be sent across any given link, or what it costs to transfer data. As a result, we may have two providers, so if it would cost $0.10/mbps to send traffic through provider A, but cost $0.25/mbps to send it through provider B, that is an incentive for an ISP to prefer receiving traffic over either link, but avoid sending it via provider B if there are cheaper peers available.
What this means is that it’s entirely possible (and in fact, more common than not) for traffic to go out through one path and come back through a separate path:
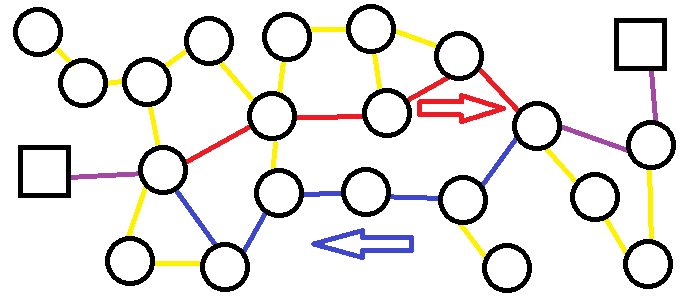
In this example, we still see purple for the common links, but the red shows traffic going from the left to the right, while the blue shows traffic from the right to the left. See how it took a different path? There are any number of variables that play into this, and it usually comes down to the providers preferring traffic due to capacity concerns or, more likely, cost to transmit data.
Let’s take a practical example with two traceroutes. I used a VPS in Las Vegas, NV, and a free account at sdf.org and from each one, traced the other. Here’s the trace from Vegas to SDF:
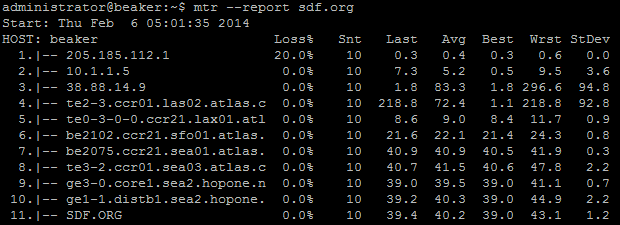
And the return path:
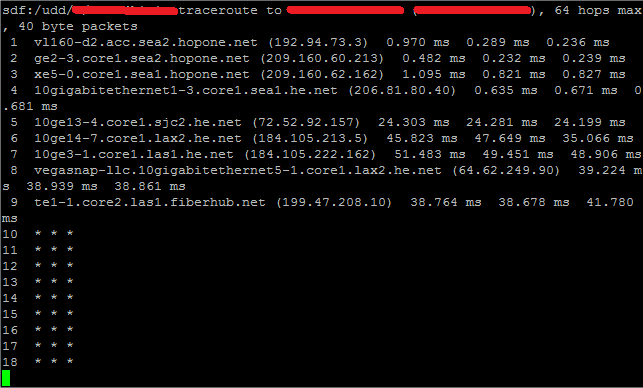
Now, it’s cut off in the screen, but I happen to know that “atlas.c …” is Cogent, so from a simple analysis we see that traffic went to SDF via Cogent, and came back via Hurricane Electric, or HE.net:
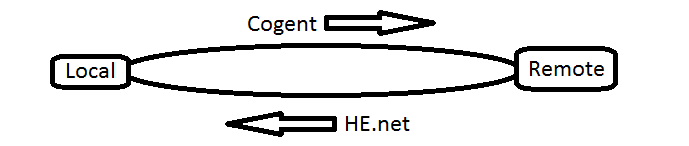
For this reason, whenever you submit traceroutes to your ISP to report an issue, you should always include, whenever possible, traces in both directions. Having trouble reaching a friend’s FTP server? Ask them to give you the traceroute back to your network. If the issue is in transit, there is a 50/50 chance it’s on the return path, and that won’t show up in a forward trace.
The network engineers investigating your problem will thank you, because they didn’t have to ask.